Big adventures, big data
What started with the idea to share my favorite 50 photos from this year, spiraled down the rabbit hole of data collection and visualization. It was a fun endeavor and let me flex my development muscles by using a few new frameworks and APIs to gather and visualize all the data.
As I poured through the data, I was surprised and impressed by some of what I accomplished this year.
Below is a little breakdown of this data and a look back on what 2022 brought me. I hope you enjoy perusing it as much as I did documenting it.
*More fun when viewed on a desktop
Transportation
I was able to visit 12 countries, 10 of which were new to me. To accomplish this, I traveled nearly 32,000 kilometers(~20,000 miles).
To cover this distance, I embarked on approximately 91 separate transit journeys, using six different modes of transportation. This doesn’t include the countless subway, tram and bus rides within the major metros I visited.
Trains were my most used mode, but it varied from country to country, and month to month. I took a bunch of ferry boats in Croatia, exclusively buses in Albania and Italy was dominated by train travel.
And while I generally made my way southeasterly, I did actually head in all directions.
Accommodations
After more than 10 months on the road, I’ve stayed in nearly every imaginable type of accommodation. I’ve grouped them into six larger categories.
I stayed in hostels more than any other type, but spent more nights in rented apartments in total. I found a good cadence between staying around people in hostels and guesthouses, and alone time in apartments.
And as with transportation, the type of accommodation varied from place to place and month to month. My longest hostel stay was the 14 nights in Istanbul. The chart is perhaps skewed by the fact that I rented an apartment in Torre A Mare for an entire month.
Places of Interest
I have been “checking in” with the Foursquare/Swarm app for over a decade now. Before this adventure, it was mostly pointless. But while traveling I've found its a great way to document where I’ve been. Its also become invaluable in giving recommendations to other.
The Foursquare API returned a mountain of data, and I could slice it up so many different ways. What I’ve opted for here is a simple map with all the check-ins from five broad categories.
Clicking the button will toggle each category on the map. Clicking any point on the map will zoom the map into that point's location. Click the Reset button to zoom back out to see it all again.
** Foursquare has discontinued this ... I have had to remove this map until I can update my code base **
Some additional fun facts that didn't fit into a neat little chart.
- UNESCO World Heritage sites visited: 31
- National Parks visited: 8
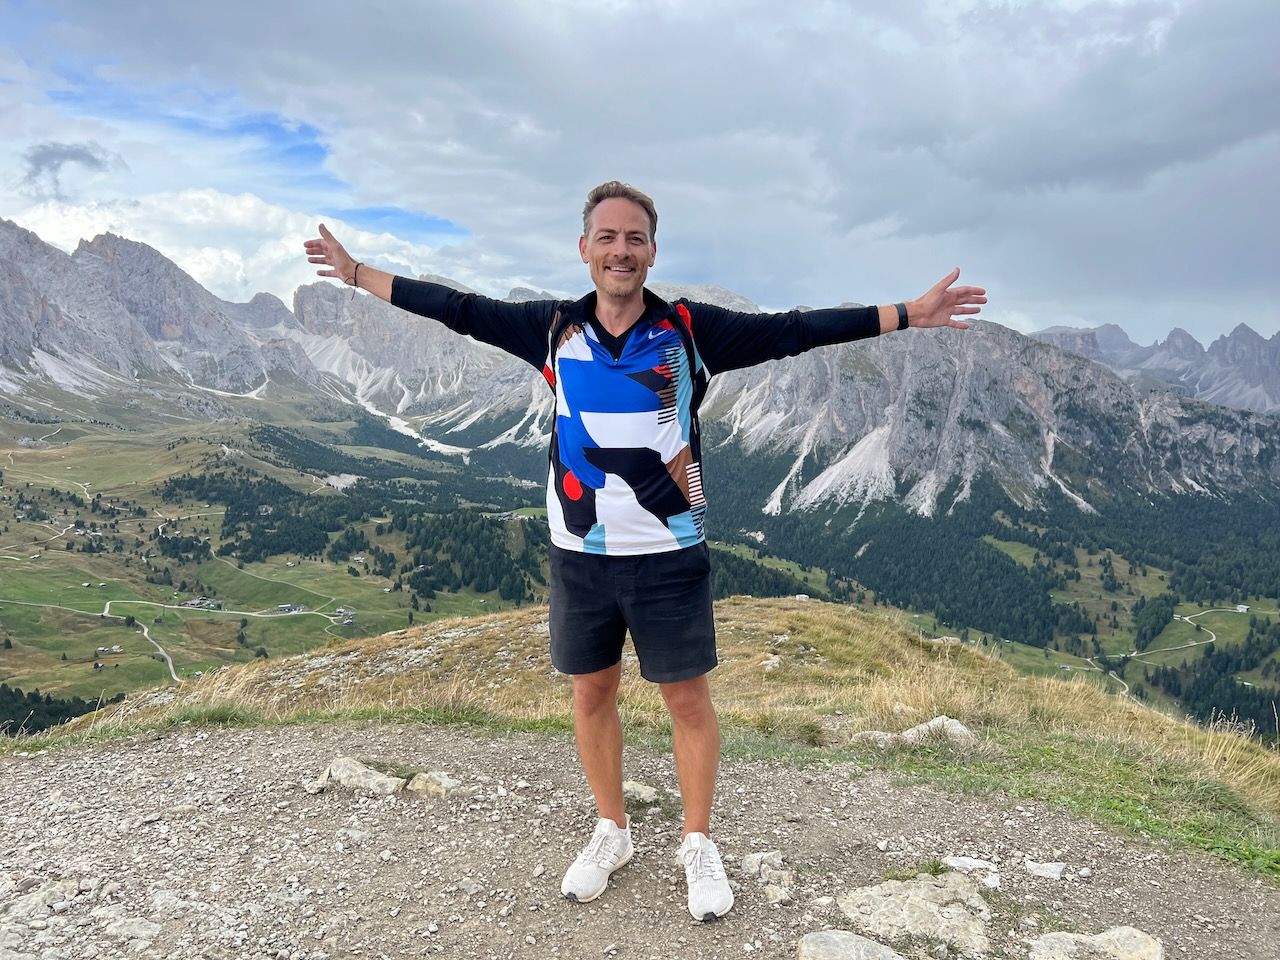
- Highest Elevation reached: 2518m (8261 ft)
- Cities visited: ~73
- Negronis consumed: 100+ ... easily
Exercise
Using my Apple Watch fitness data, I was able to cobble together a few interesting stats. I walked roughly 4 million steps, or 3200km (~2000 miles) in the last 10 months. Which sounds like a lot until you average it out. It’s a less impressive 7 miles per day at an average just shy of 13,000 steps.
Regardless, all this has helped me lose just over 25 pounds on this adventure. I expected some weight loss, but this was not expected. In March I weighed over 190lbs which is far more than I should, so I’m happy to be sitting at around 165lbs today.
Media
I’ve taken thousands of photos and videos on this trip, with roughly 5,400 not getting deleted. Interestingly, some months have been less photogenic than others.
I’ve also written 40 blog posts about my adventures, with a total of 43,558 words written, at an average of 1399 per post. May was my most prolific month with 8 posts, while I was the most mouthy in September writing an average of 2,111 words per post.
People
I spent the first couple of months with friends and family, so my solo travels didn't really kick off until I reached Croatia in May.
The sheer number of people I crossed paths with since then is incalculable. That said, there's been quite of few that made an impression on me. Here's a quick list of some of those names.
Peter, Leah, Tristan, Laura, Ramona, Marianna, Lucas, Imet, Andre, Cassandra, Meite, Zac, Emma, Olivia, Max, Nina, Aaron, Yoga, Eddie, Haven, Jaime, Florence, Kris, Leone, Michael, Kora, Jason, Stephanie, Nick, Steph, Matteo, Clarke, Ridvan, Ozan, Zeynep and Ali.
As mentioned before, people are what make the memories, and these people helped make the best moments even better. If any of you happen to be reading this, thank you from the heart of my soul. You've made a lasting impression on me and I will be forever grateful for that.
So there you have it. My 2022 adventures in a nutshell. What started out as a search for photos, yielded a unique perspective on my adventures.
As for the photos, that post is still coming. I felt that the images would get lost amongst all these charts and want them to really shine when you see them.
All of this data represents but a small portion of stories and memories I've made in 2022. But I love that the data exists and allows me to relive the adventures over and over again, one data point at a time.
I am full of immense gratitude for the opportunity to have lived all these stats. The last 10 months have been an incredible roller coaster of travel, emotions, contemplation, thought, reflection and personal growth.